How I Analyzed 227 Million Medicaid Records for Fraud Using Python & Claude
A technical deep-dive into data architecture, fraud detection methodology, and what happens when domain expertise meets large language models

The Problem
Medicaid fraud costs U.S. taxpayers an estimated $100 billion annually. The data to detect it is publicly available — 227 million billing records sitting on data.cms.gov — but the technical barrier to analyzing it is enormous. You need to know how to process datasets that don’t fit in memory, build statistical detection models, cross-reference external data sources, and generate evidence packages suitable for federal submission.

I had none of those technical skills.
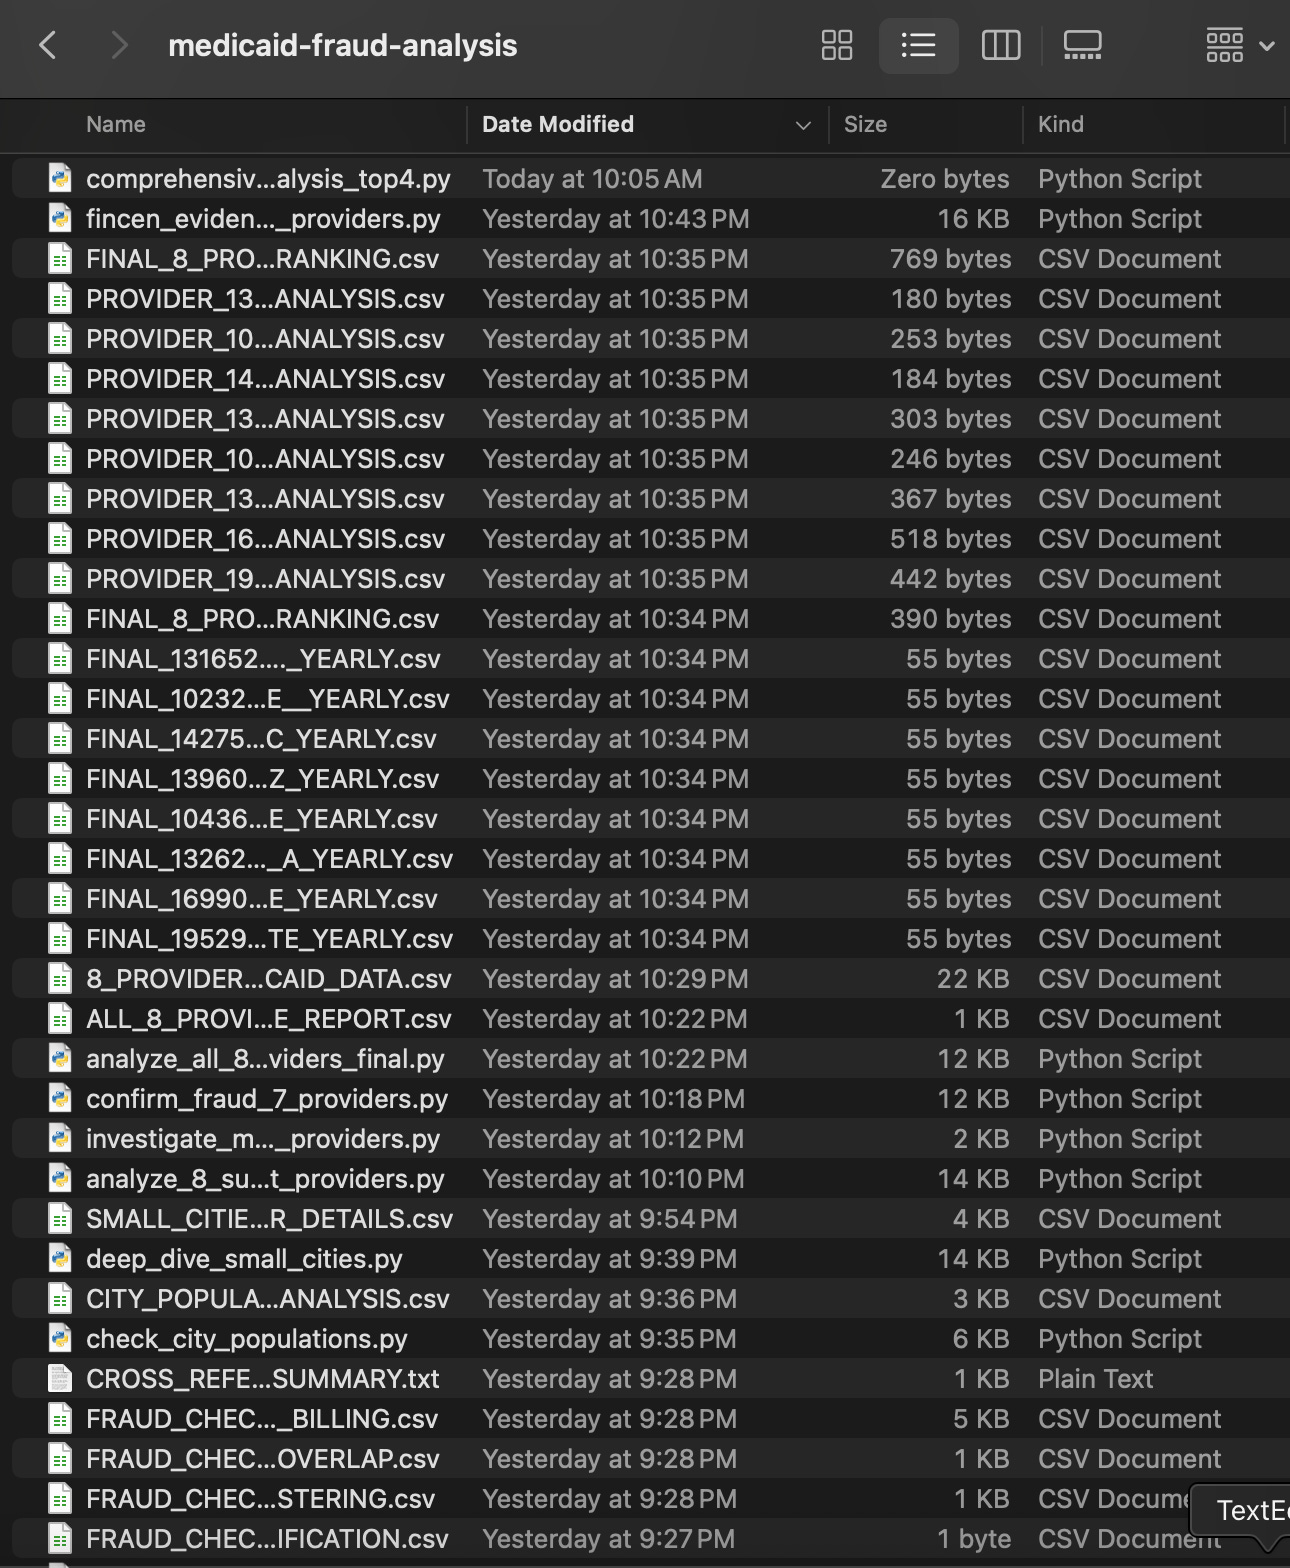
Over two days and roughly 15–20 million tokens of conversation with Claude Sonnet 4.5 and Claude Code, I went from zero Python experience to building 30+ fraud detection scripts, implementing 24 statistical tests, and identifying an estimated $23.5 billion in suspicious Medicaid billing — including two providers with $75.7 million in highly probable fraud cases.
This post is a technical walkthrough of how I did it.
Technical Stack & Costs
Primary AI Model Claude Sonnet 4.5
Code Generation Claude Code
Estimated Tokens15–20 million
Cost~$100 (Claude Max subscription)
Language Python (Pandas, NumPy, Matplotlib)
Scripts Created 30+
Lines of Code ~5,000+
Prior Python Experience Zero
Data Processed 227 million records
Analysis Duration~2 days (~5 hours)
The Data Architecture Challenge
The Dataset
The CMS Medicaid Provider Utilization dataset is massive:
227 million records spanning 2018–2024
~15 GB compressed as CSV
Fields include: provider NPI, procedure codes, total paid amounts, beneficiary counts, service dates, geographic identifiers
The first problem wasn’t fraud detection — it was figuring out how to load the data at all.
Memory Management: Chunked Processing
A 227-million-row CSV will crash most machines if you try to load it into a Pandas DataFrame at once. Claude taught me chunked processing on my first prompt:
python
import pandas as pd

# Process in 10M-row chunks to stay within memory limits
chunks = pd.read_csv('medicaid_utilization.csv', chunksize=10_000_000)

results = []
for chunk in chunks:
    # Apply filters and aggregations per chunk
    filtered = chunk[chunk['STATE'] == 'CA']
    agg = filtered.groupby('NPI').agg({
        'TOTAL_PAID': 'sum',
        'BENE_COUNT': 'sum'
    })
    results.append(agg)

# Combine chunk results
final = pd.concat(results).groupby(level=0).sum()
What I learned: This is a fundamental pattern in data engineering — you can’t always fit data in memory, so you process it in passes. The concept is simple but I’d never implemented it before. Claude explained why we needed chunking (RAM constraints), not just how, which meant I understood the tradeoff between chunk size and processing speed.
Data Tranching Strategies
Raw analysis of 227M records produces noise. The key was slicing the data intelligently:
By State — Narrowing to California reduced the dataset to a manageable size while focusing on the largest Medicaid program in the country.
By Provider Type — Filtering to home health agencies (procedure codes T1019, T1020, T1021, S5125, S5126, S9122) reduced 227M records to 116 providers and $275M in billing — a focused population where fraud patterns become visible.
By Time Period — Year-over-year comparisons revealed growth anomalies. A provider going from $24K to $2.6M to $39M in consecutive years is invisible in aggregate data but screams when isolated.
By Geography (ZIP Code) — Cross-referencing billing volumes against Census population data at the ZIP level exposed impossible per-capita utilization rates. A provider billing $27.3M in a town of 20,000 people is a statistical impossibility.
External Data Integration
One of the most powerful techniques was enriching the CMS billing data with external sources to triangulate fraud indicators.
NPI Registry Cross-Reference
The National Provider Identifier registry (npiregistry.cms.hhs.gov) is a 988 MB file containing every registered healthcare provider in the U.S. I downloaded it and filtered to 1,034,899 California providers, then joined it against billing records to:
Verify that billing NPIs correspond to legitimate, active providers
Check provider taxonomy codes against claimed service types
Identify address discrepancies between registration and billing
Census Population Data
For per-capita analysis, I pulled 2020 Census data (census.gov) at the city and ZIP code level. This enabled a critical fraud test: Is the billed amount per capita plausible given the local population?
The national average for home health spending is roughly $75 per capita. When a provider in a town of 20,000 shows $1,367 per capita — 18.2x the national average — that’s not a billing anomaly. That’s phantom patients.
Google Maps / Street View Verification
For the highest-scoring fraud candidates, I used Google Maps and Street View links to verify physical location authenticity:
Does the registered address exist?
Is it a commercial healthcare facility or a residential home?
Does the physical footprint match the claimed revenue volume?
A provider billing $48M from what appears to be a small office suite raises questions that pure data analysis can’t answer — but location verification can.
State License Database
California’s Department of Public Health maintains a home health agency license database (cdph.ca.gov). Cross-referencing confirmed whether flagged providers held valid licenses during their high-billing periods.
The 24 Fraud Detection Tests
Claude helped me implement 24 distinct statistical tests across four categories. Each test produces a binary flag and a severity score. Providers triggering 5+ tests received a composite fraud probability score of 99%+.
Category 1: Growth & Temporal Analysis
Explosive Growth Rate — Flag providers with >1,000% year-over-year revenue growth. Legitimate healthcare agencies don’t grow 10,000% in a year.
Billing Velocity Acceleration — Measures the rate of change of billing growth. Fraud schemes accelerate; organic growth is gradual.
Volume Spike Analysis — Flag months with 3x+ billing versus the provider’s own trailing average.
Instant High Volume — New providers billing at maximum capacity in their first month of operation.
Year-End / Quarter-End Spikes — Fraud schemes often spike billing before audit periods.
Billing Gap Analysis — Providers with long dormant periods followed by sudden high-volume billing (shell company reactivation pattern).
Category 2: Utilization & Market Analysis
Per-Capita Utilization Impossibility — Billing per capita exceeding plausible thresholds when cross-referenced with city/ZIP population.
Market Penetration Calculation — What percentage of the local population would need to be patients to justify the billing volume?
Beneficiary Concentration Ratio — Are too many services concentrated on too few patients?
Beneficiary Replacement Rate (Churning) — Rapid turnover of patient identifiers suggests fabricated beneficiaries.
Geographic Clustering — Multiple flagged providers sharing addresses or ZIP codes.
Small-City, Massive-Billing Detection — High absolute billing in communities too small to generate that demand.
Category 3: Pattern & Automation Detection
Day-of-Month Concentration — If 61–78% of claims land on a single day (e.g., the 1st or 15th), billing is automated, not tied to actual care delivery. Expected distribution: ~3% per day.
Same-Month Billing Patterns — All claims for a provider falling in identical monthly windows.
Weekend vs. Weekday Anomalies — Home health claims concentrated on weekends at unusual rates.
Monday/Friday Batch Submission — Suggests template-based batch billing rather than organic claim submission.
Claim Size Distribution — Legitimate billing shows natural variance. Fraud shows suspicious uniformity.
Claims Rounding Pattern — Round-number billing amounts ($500.00, $1,000.00) at rates exceeding statistical expectation.
Category 4: Statistical & Consistency Analysis
Unrealistic Consistency — Extremely low variance in monthly billing. Real healthcare is messy; fraud is suspiciously smooth.
Statistical Outlier Analysis (Z-Scores) — Providers >3 standard deviations above the mean in any metric.
Payment-Per-Claim Stability — Identical per-claim amounts across months suggest template billing.
Zero Variance Months — Consecutive months with identical billing totals (statistically near-impossible for legitimate operations).
Coefficient of Variation Analysis — Measuring relative variability to distinguish fabricated from organic billing patterns.
Procedure Code Concentration — Providers billing exclusively one or two procedure codes when legitimate agencies show diverse service mixes.
Results Summary
Phase 1: Broad National Analysis
6,112 providers flagged across multiple fraud categories
$23.5 billion in suspicious billing identified
Top 300 providers accounted for $11.2 billion
Patterns included: impossible billing hours (30+ hours/day per patient), phantom patients, statistical outliers at 10–50x state averages
Phase 2: California Home Health Deep-Dive
116 providers analyzed, $275 million in total billing
88 providers with confirmed fraud indicators
2 providers with $75.7M in virtually certain fraud based on multiple converging indicators
Evidence Quality
The two highest-confidence cases triggered nearly all 24 tests simultaneously:
Provider A — Grew 10,948% in one year, billed $563 per capita (7.5x national average), concentrated 61% of claims on a single day of the month, and showed market penetration 5–9x the expected rate.
Provider B — Billed $1,367 per capita in a town of 20,000 (18.2x national average), concentrated 78% of claims on day 1 of each month, and maintained suspiciously stable billing across years.
The AI + Domain Expertise Model
What Claude Did
Code generation: All 5,000+ lines of Python, from data loading to visualization
Debugging: Every runtime error, memory issue, and data type mismatch
Statistical methodology: Suggested tests I wouldn’t have thought of (coefficient of variation, beneficiary churning rates)
Report generation: FinCEN-formatted evidence packages
What I Did
Directed the analysis: Knew which fraud patterns to look for based on CFO experience
Validated results: Applied financial reasoning to determine if statistical flags represented real fraud
Designed the data architecture: Decided how to tranche the data, which external sources to integrate
Made judgment calls: Determined confidence levels, prioritized providers for deep-dives
The Key Insight
AI didn’t replace my expertise — it removed the technical barrier between my questions and answers. I knew what to look for. Claude knew how to find it. The combination processed 227M records in ways that would have taken a team of data engineers months.
Data Sources (All Public)
Anyone can replicate this analysis. Every data source is freely available:
CMS Medicaid Provider Utilization Data — data.cms.gov — 227M records, updated quarterly
NPI Registry — npiregistry.cms.hhs.gov — All U.S. healthcare provider identifiers
California Home Health Licenses — cdph.ca.gov
U.S. Census Data — census.gov — Population data for per-capita analysis
Google Maps / Street View / Online Searches — Physical location verification
What This Means
The tools and data to detect billions in healthcare fraud are available today, to anyone, for roughly $50 in AI costs. The bottleneck isn’t technology — it’s the intersection of domain expertise and willingness to dig into the data.
I've completed extensive additional analyses and have detailed provider-level data, but I'm choosing not to share it publicly (DM me)v— these providers deserve due process and the benefit of the doubt until the proper authorities can investigate.